Keeping a-head in the clouds
One of the great things about developing on today’s cloud platforms is elastic computing. You never know what the peaks are going to look like, but you don’t want to pay for hardware you’ll only use once in a blue moon. So you opt for a dynamically adaptive scalable solution.
If you’re read any of my posts about jsErrLog (or “jsErrLog posts” if it’s still down) you’ll know that’s what I did for that service. As I’m offering it for free to anyone with a reasonable load I needed something as cost effective as possible (ie free!). When I built it I looked at Windows Azure, Amazon’s EC2, a few smaller options, Virtual Private Servers and finally settled on Google AppEngine - in common with the others it offered a number of options for programming languages and data storage but the big bonus was a no-nonsense the free tier.
Sometimes however things don’t go quite as planned…
So I stood the service up, and over time it’s racked up a number of users (200+ sites have used it at one time or another, about a dozen are active users) and while there have been a couple of surprises that triggered brief outages when we tipped a limit they’ve mostly been easy to solve by rate-limiting what an individual site could do (I store the first 250 errors in any 24 hour period for a site, then throw the rest away).
Today as I had my first cup of coffee I checked email - one had a red exclamation mark next to it. At 4:06am jsErrLog has started serving HTTP 503 rather than behaving as it’s normal rock solid self. Intrigued I checked the logs and discovered that both incoming and outgoing bandwidth had been exceeded. I’d never had that problem before… none of our users generated enough traffic to hit my 1GB daily limit.
So I had a closer look at the dashboard

Something unexpected had started hitting the service hard… normally we tick along at the 40MB memory mark but a spike had blown that - and other counters - by 10x or more.
Looking at the traffic for the day was even scarier (some graphs - eg for utilization and milliseconds per second showed historic data rounded to zero the spike was so extreme)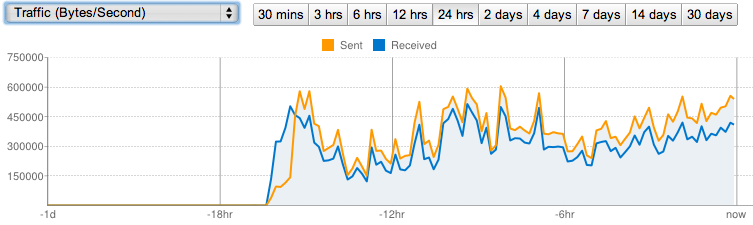
I was getting 600+ requests a second (vs the usual single or double digits), and it didn’t look like it was stopping any time soon…
So, where was it coming from?
At the time of writing a single site - a major US home shopping site - had driven over 24 million requests in 15 hours (as opposed to a normal “busy” day of 100k - now up to 27m in 18 hours) and is showing no signs of stopping. That 250 logged errors for my rate limiter? Blown away in a few minutes!
Now, don’t get me wrong, I am insanely flattered that they decided to deploy my little service. But did they not stop to consider what they were doing? Sure, it runs in the cloud so magically it can scale but … there was no contact, no communication and do they really know what my service is doing (if nothing else what data could I be capturing - as it turns out nothing apart from the usual server logs - or what payload I could be returning).
I reached out via their contact form - but obviously confused whoever read it because they pointed me to a form to fill in if I wanted to become an affiliate! Luckily, via a mutual friend, I tracked down an email address for someone who works at the site and have reached out but so far I’ve not heard back and I’m rather stuck until I do (sadly the AppEngine black list won’t let be block the referring site, though I have opened a request for that)
I feel bad for the other sites using the service who are going to be stuck without data until this problem is resolved - either by the giant site stopping sending traffic our way, or cutting me a check to let me scale to support them for as long as they want to use the service!
And that’s the moral of this tale … the cloud scales, but there is a cost if you want to stay ahead of the cloud (sorry for the terrible pun in the title)
I will update this post then - hopefully - there is a resolution. In the meantime if anyone desperately needs the service back up I can spin up a new instance in the meantime, just leave me a comment or hit me up via @offbeatmammal
Update [Nov 21 2013]: Managed to get in touch with the folks who own the site, they’d implemented their own collector but for some reason (still trying to work out exactly why) it looks like the updated URL wasn’t getting picked up so it was still hitting my service. Great guys who fixed things up really quickly so tomorrow when AppEngine re-sets all should be good.
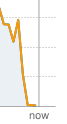
If I’d been smart enough to charge by the hit on the service I’d hate to see this graph but after sustaining 30+m impressions a day for a couple of days (peaking just under 800 requests a second!) it’s nice to see things going back to normal